Accelerate innovation with Polarion ALM
Release faster and more frequently while maintaining end-to-end traceability and visibility into your application lifecycle.
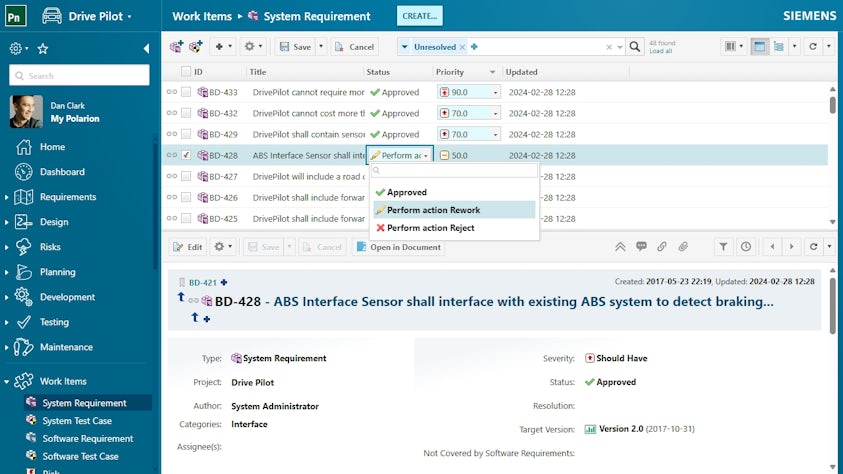
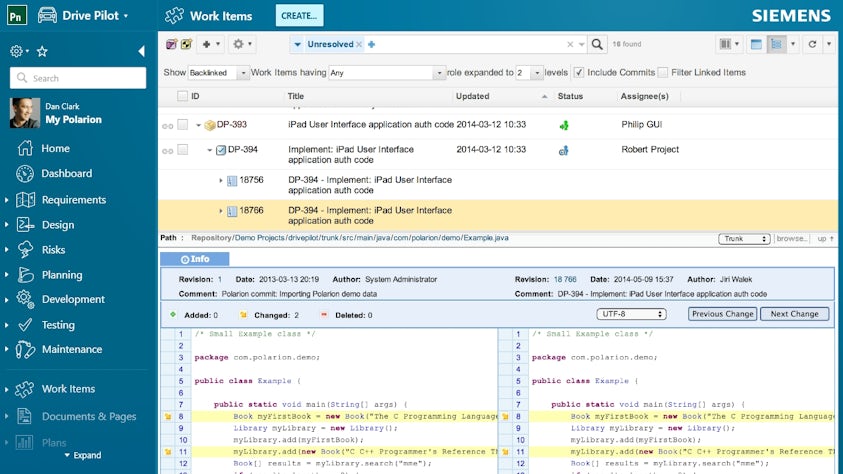
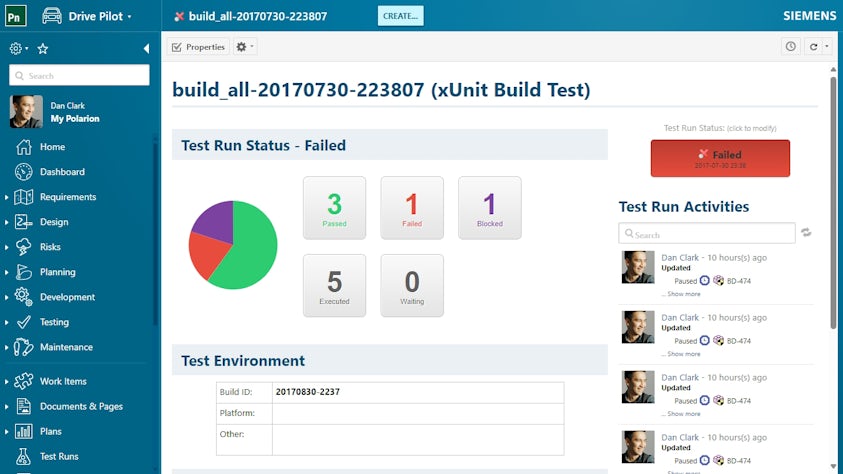
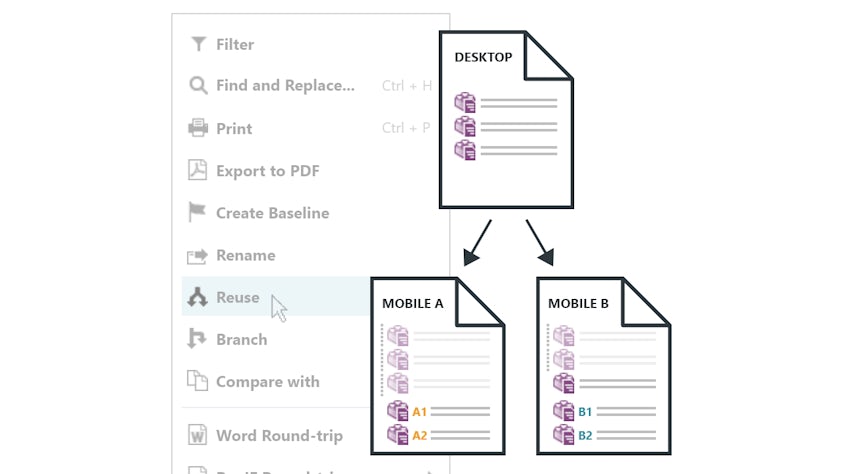
Define, build, test and manage complex software systems in a unified 100 percent browser-based solution that serves small teams or thousands of users.